
Your Claude Code usage,
always in the tray.
A native Windows tray monitor that draws your rate-limit usage as a crisp, DPI-aware icon — with burn-rate projection, per-session cost at API list prices and a context audit. Zero config: it reuses the login claude already stored.
Everything you need, nothing you don't
Built for clarity on real displays — it lives entirely in the tray and tells you exactly where you stand.
Crisp at any DPI
The percentage is drawn as a vector at the exact size the tray requests — no downscaled bitmaps. It stays razor-sharp at 125–200%. Its colour says what the number is about: white for the 5h session, yellow for the 7d week, and orange whenever extra usage is paying — the one thing on the tile that still says so when 0 left leaves no fill bar to.
Task-Manager-style fill
A vertical bar rises from the bottom in proportion to your usage, with a 3D bevel for relief. Blue while you are on track, red when you are not.
Smart projection
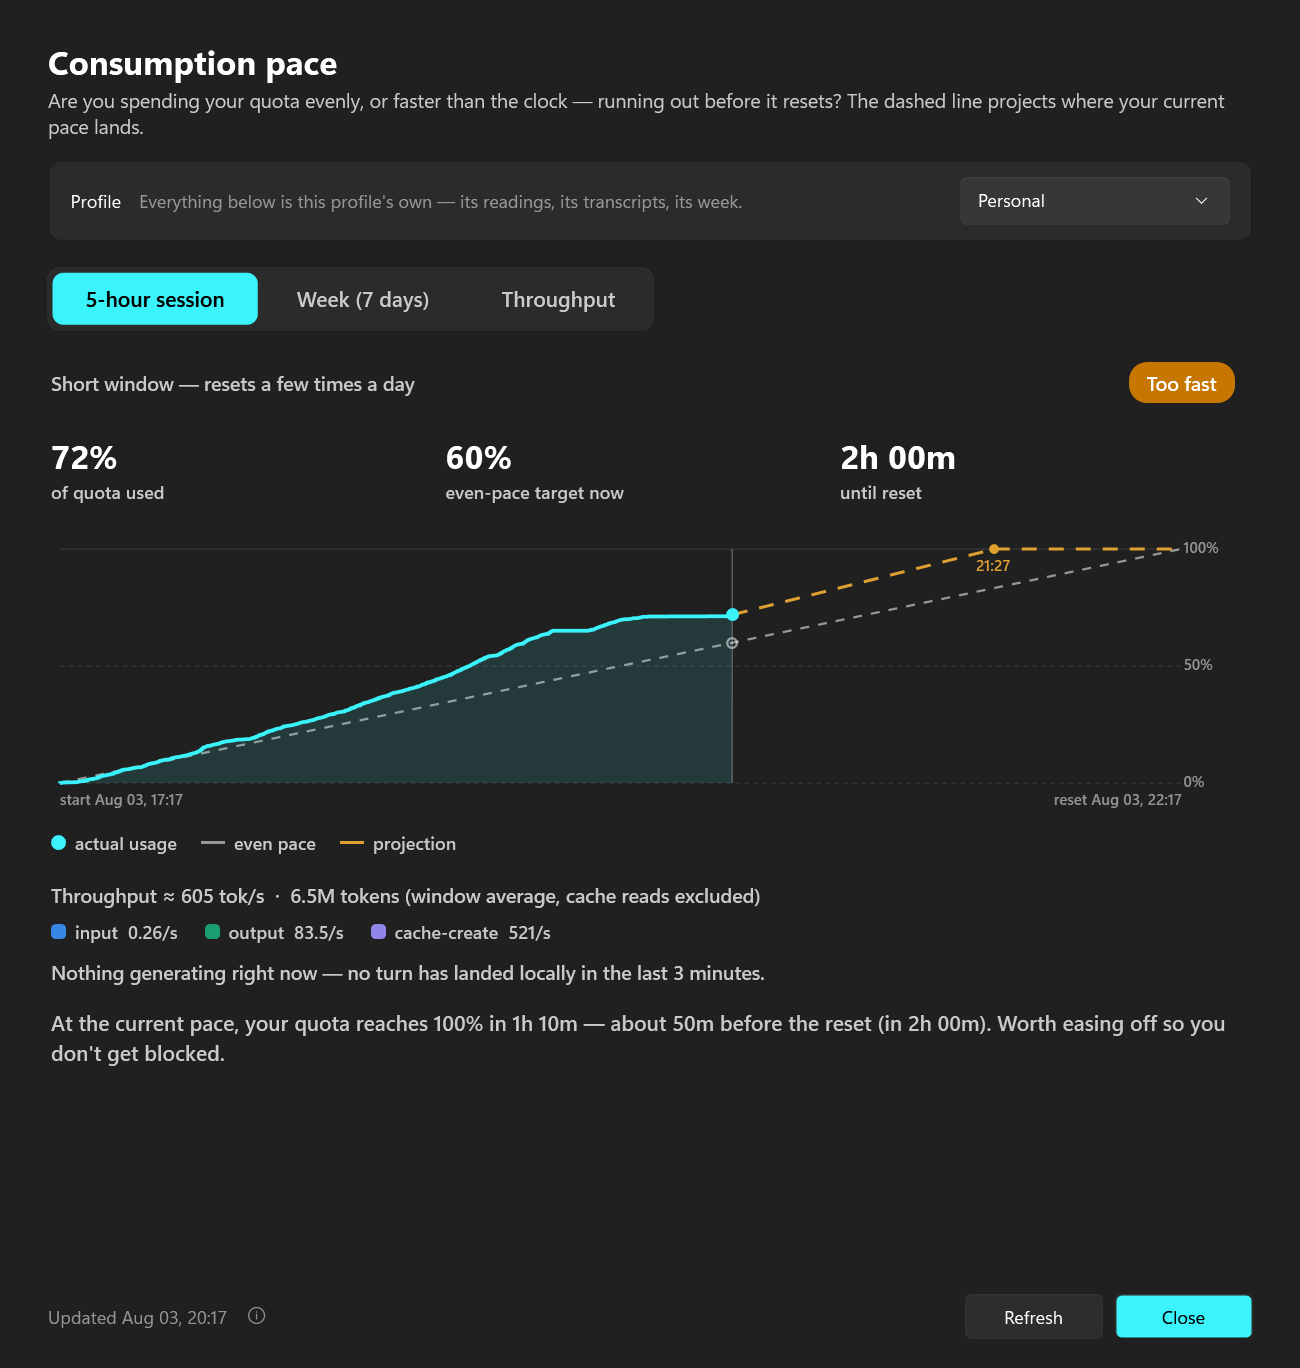
Projects when you would hit 100% — warning you before the window resets, not after. A proportional pace line for the 7-day week, burn-rate regression for the 5h session.
24h usage insights
A local, cost-weighted breakdown of your last 24 hours — by model, by subagent, by large-context request. Computed offline from your own transcripts.
Zero configuration
No API key to paste, no environment variable to set. It reuses the OAuth token Claude Code already stores when you log in.
Self-updating
Checks GitHub Releases and offers a one-click in-app update. Per-user install, no administrator rights.
One hover tells the whole story
The tooltip packs everything into a single read — no dashboard, no browser tab.
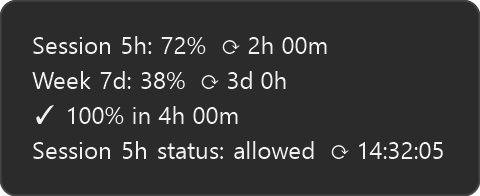
- ✓5h session and 7d week usage side by side
- ✓Extra usage and a live countdown to the next reset — plus how long you have been paying, measured from the first reading past your included quota
- ✓The projected time to 100% at your current pace, labelled with the active window (e.g. Week 7d projection)
- ✓What the rate limit itself says about that same window — its own status, named so the word is never about a window you are not watching
- ✓Connection status — a clear not authenticated prompt on token expiry, with one-click re-auth, and the logo while connecting
It doesn't just show a number — it predicts
The icon's colour tells you what is coming. The 7-day week uses a proportional pace line — your usage against the share an even burn would have spent by now — which is accurate from the very first reading. The 5h session uses least-squares regression on a short rolling history of your utilization.
At your current pace, usage stays under 100% until the window resets. The fill bar stays its normal blue — nothing to do.
At your current pace, usage will hit 100% before the reset. The fill bar turns vivid red so you can ease off in time.
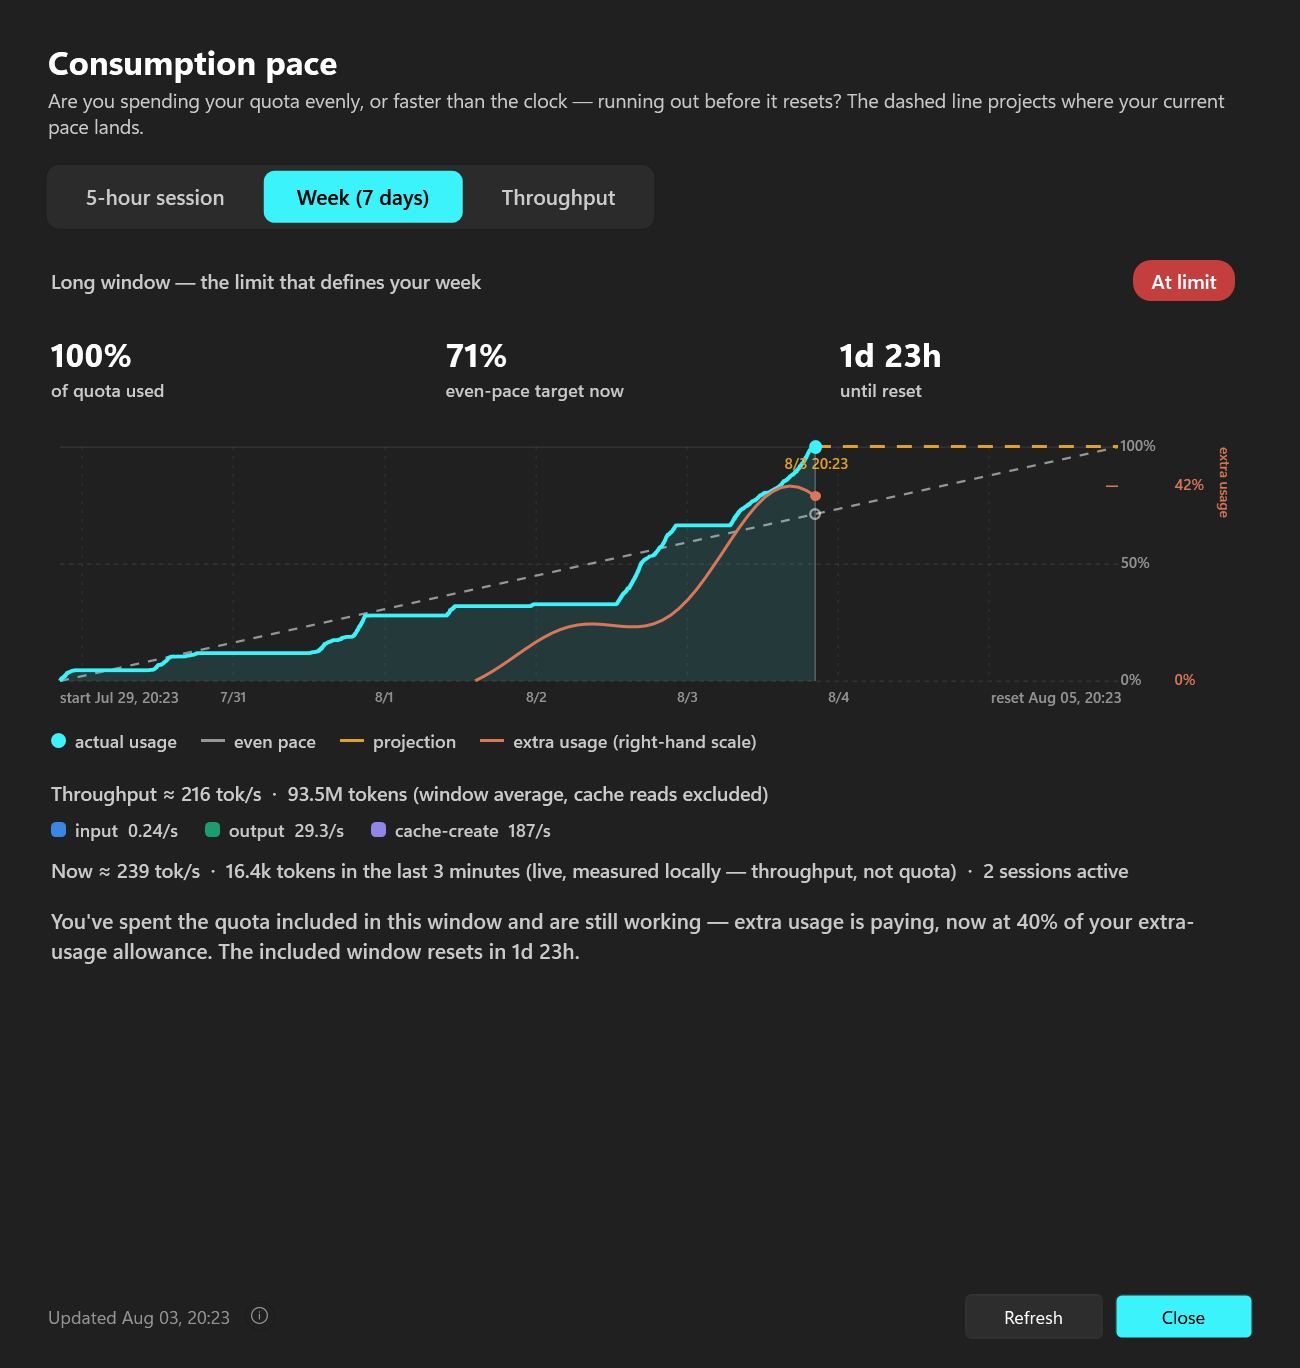
You are past the quota included in your plan and still working, because extra usage is enabled. The fill bar turns clay rather than red — red means stopped, clay means this is costing money. What it shows you is how much of your extra-usage allowance has gone: its own window, its own limit, its own reset, never mixed into the 0–100% of your included quota. And the number stops following your Show on icon pick for as long as it lasts — a 5-hour session with room left cannot report quota the account no longer has.
A window is spent and nothing is paying past it, so the account is blocked — and it stays blocked on the window that still has room. A week at 47% behind a spent session wears the red Blocked chip and says so in words, where it used to read On track over work that would not run. The tooltip deliberately says less: no percentage and no window name, because naming Week 7d there would caption the wrong number.
See your burn, not just a number
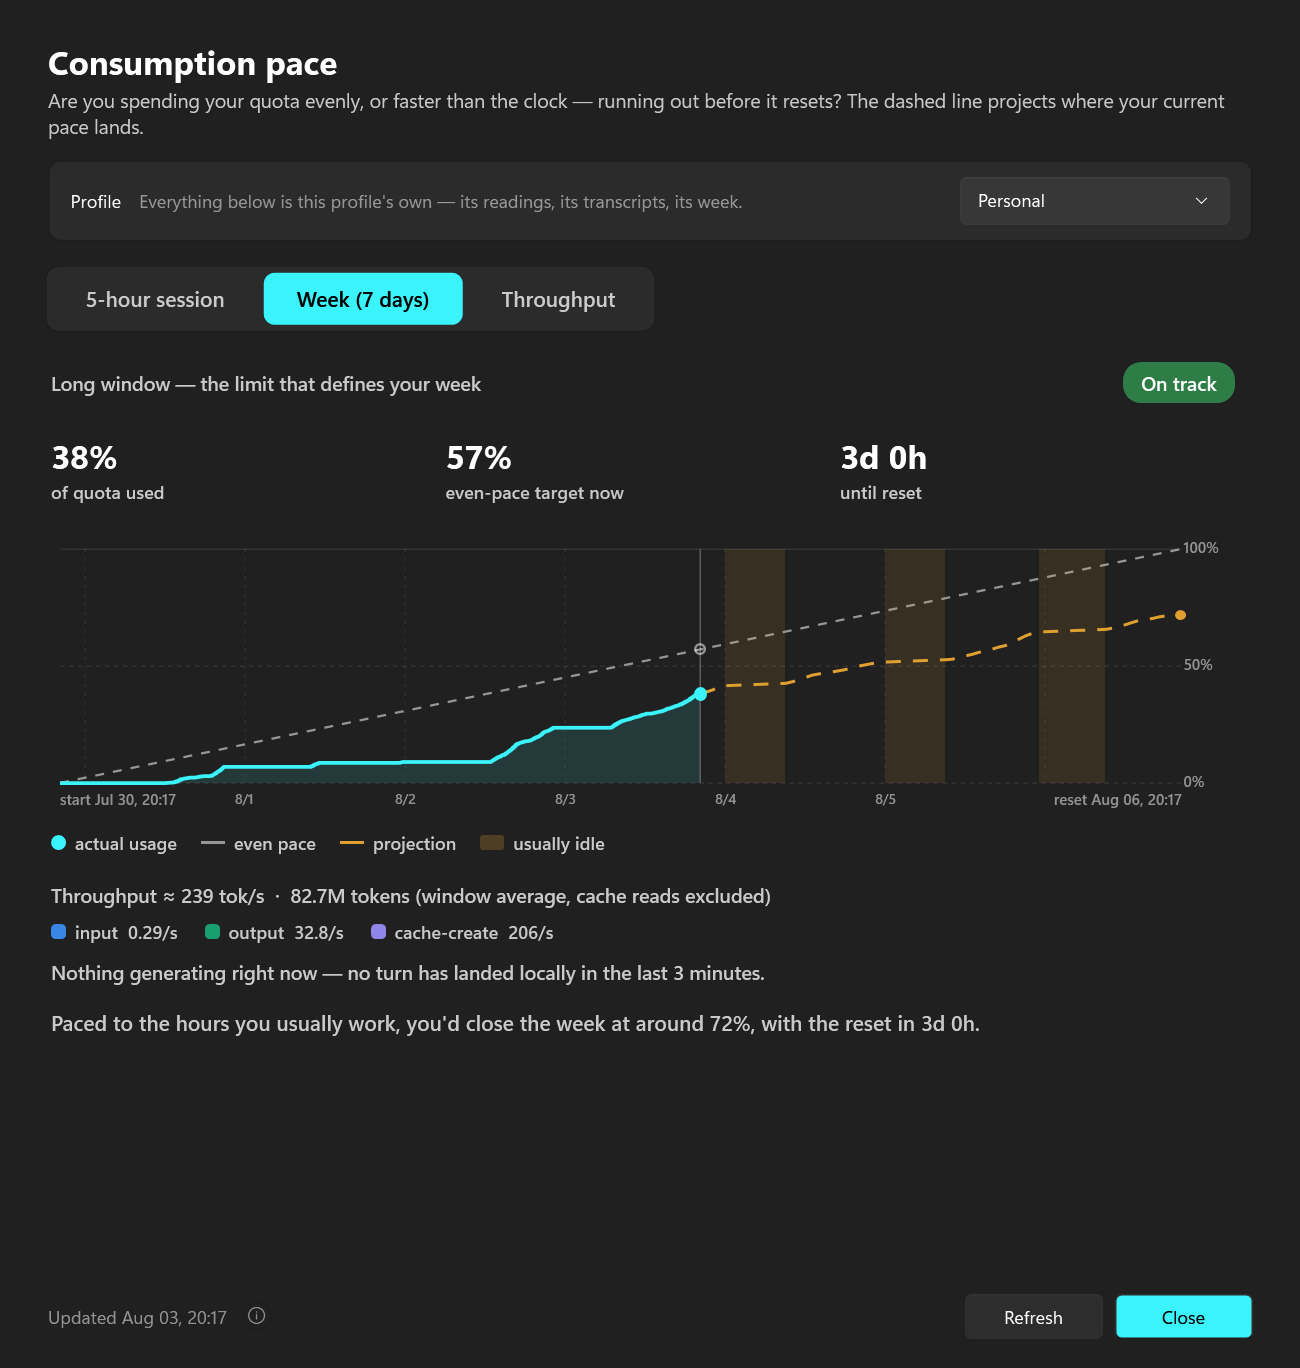
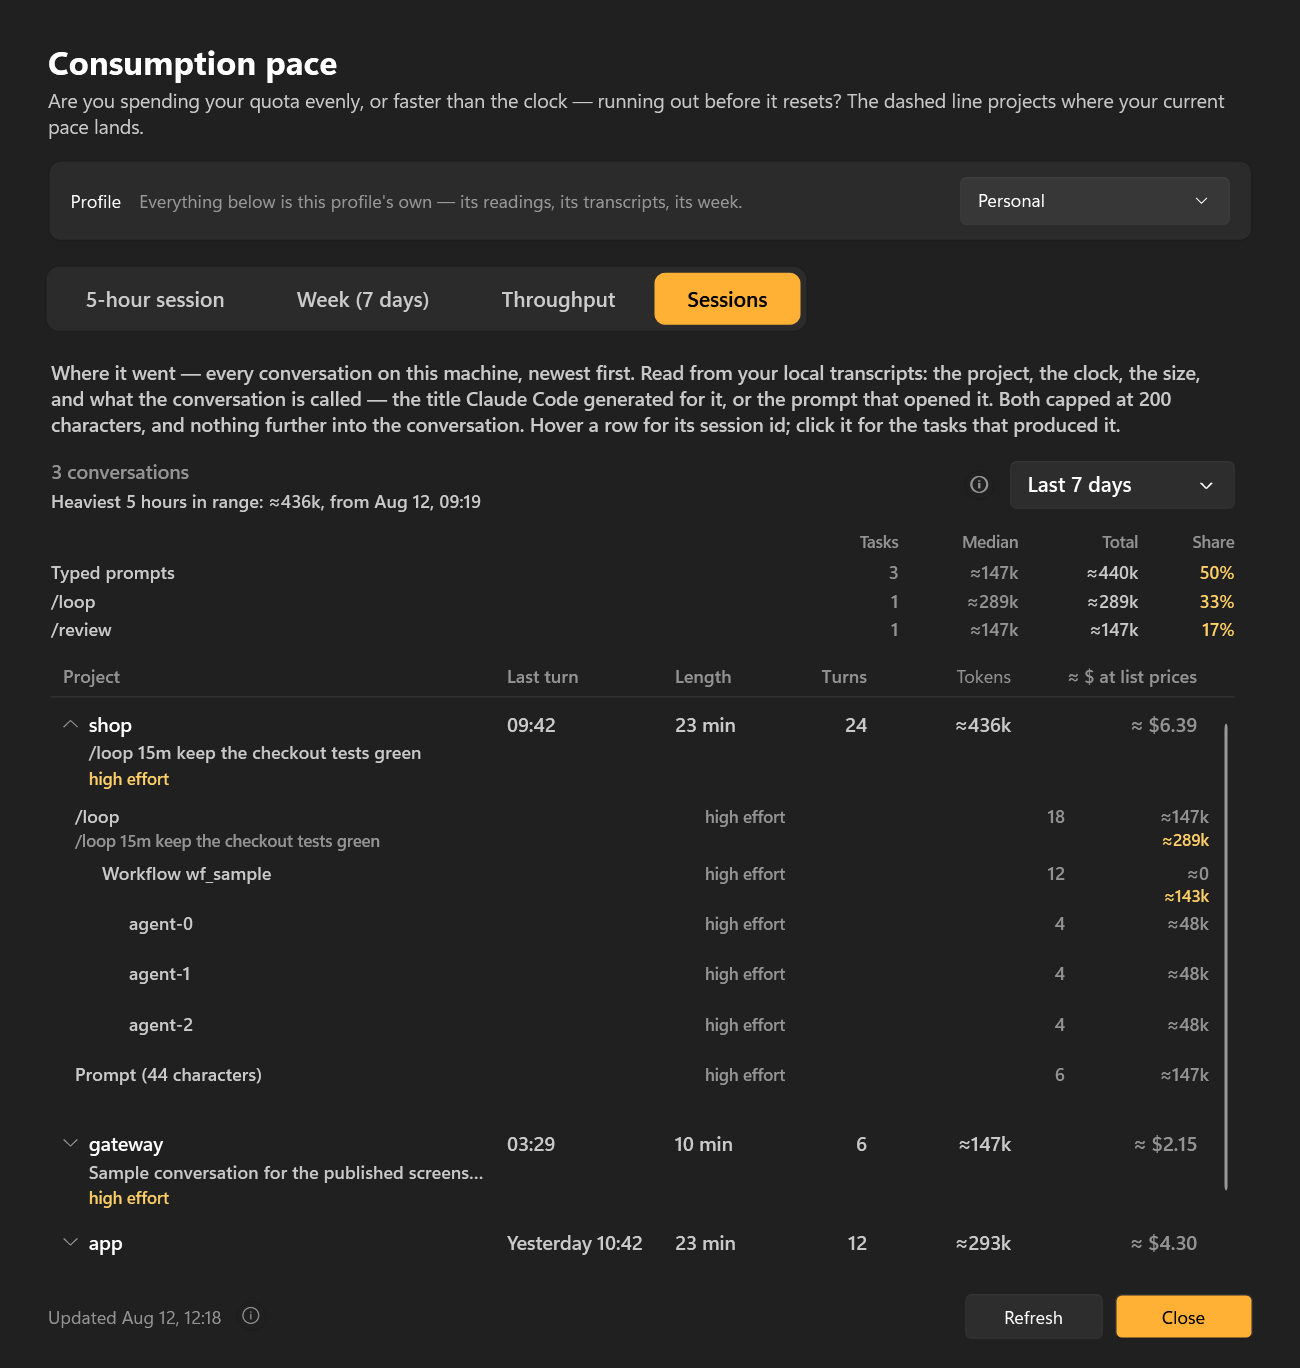
The Statistics window draws each rate-limit window as a burn-up chart: your real utilization against the even-pace line, with a dashed projection of where your current pace lands. Two tabs — the 5-hour session and the 7-day week — each with its own verdict, plus Throughput for what is running right now and Sessions for where it all went.
Paced to your hours
The weekly projection follows the hours you actually work — flat through nights and weekends (shaded usually idle), climbing while you are at the keyboard. So “you run out here” lands mid-afternoon, not at 4 a.m. It needs a few weeks of history; until then it is the plain average-pace line.
And what to do about it
“Stop now, pick it back up around Thursday 13:00, and you'd close the week at about 97%.” The earliest hour you normally work that would still save the week — and if there is not one, no advice rather than invented advice.
Last week, right behind it
Last week's burn-up is a faint line on the same axes. “Worse than last week?” becomes a glance instead of a memory test — no second chart, no extra number. A week too old to have recorded an overage says nothing rather than pretending it stayed inside.
Two numbers, two clocks
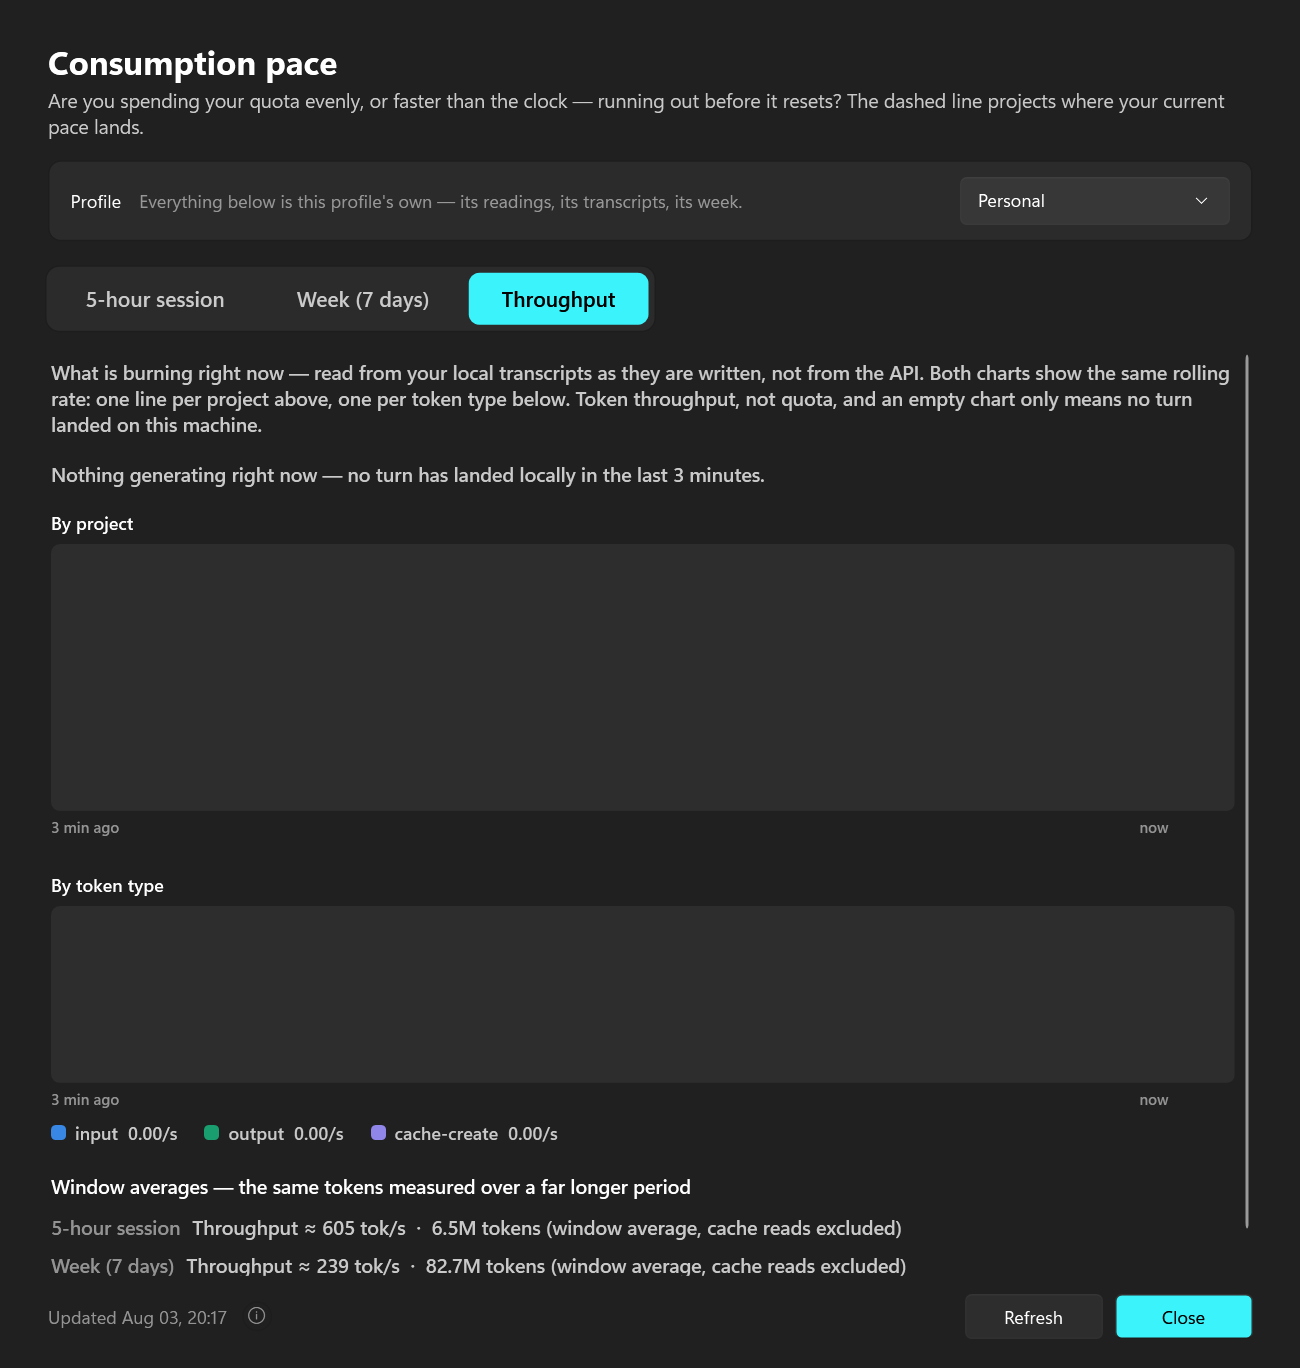
Window average — what the window has cost so far. Now ≈ 870 tok/s — what is running this minute. Both are token throughput, not quota.
Live 3-minute charts
The rolling rate sampled once a second, with the ceiling ruled and labelled in tok/s. A line slides down through a pause because the work really is ageing out of the 60-second window. It scrolls because the axis is time — the motion is the data, not a spinner. Idle goes flat, and it only repaints while the window is on screen.
Across several repos
The upper chart is one line per repo — the heaviest four, direct-labelled with their own rates, the rest as one grey “others”. Each keeps its colour while it is on screen, so nothing changes hands mid-read; the lower chart splits the same rate by token type. Because the useful question becomes where, not how fast.
All of it comes from your real logged utilization and your local transcripts as they are written — no extra API calls. Nothing leaves your machine.
When your quota comes back, you'll know — by colour
Every reset gets a celebratory, on-brand toast: a confetti burst and the quota bar visibly refilling. Each kind has its own colour and headline, so you can tell what happened the instant it appears — without reading a word.
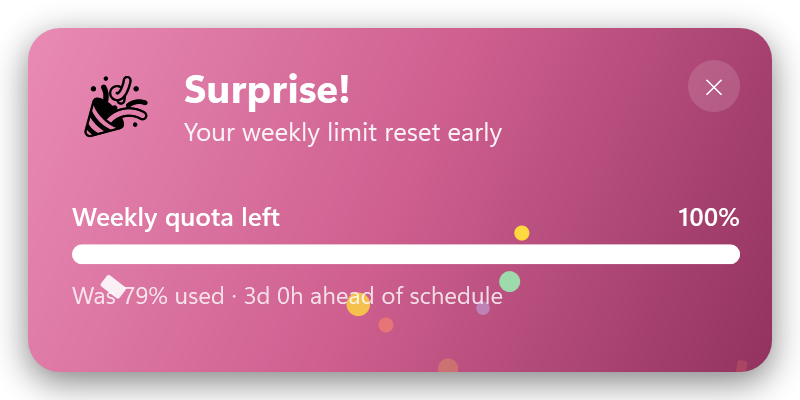
Your weekly limit reset ahead of its scheduled deadline — a known Claude Code quirk worth catching.
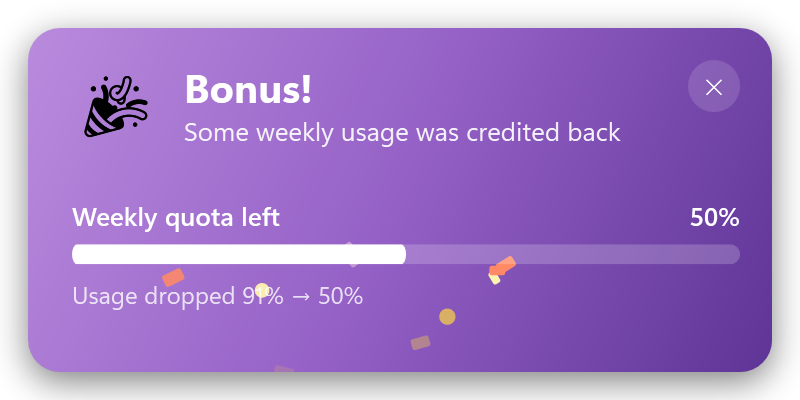
A partial mid-window credit dropped your weekly usage (91% → 50%). Found money.
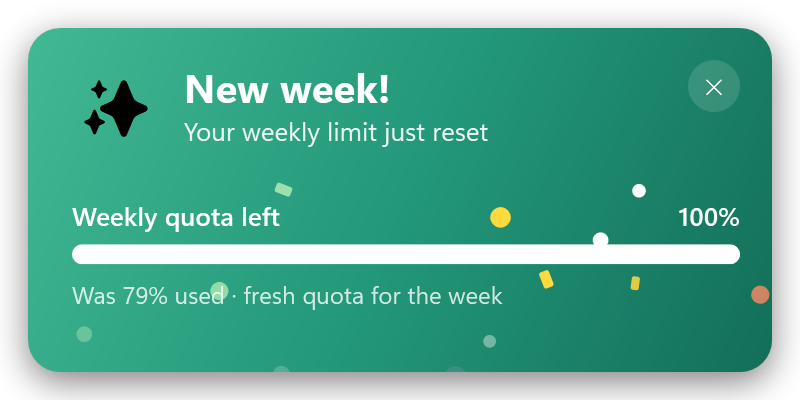
The calm, routine weekly reset — fresh quota for the week ahead.
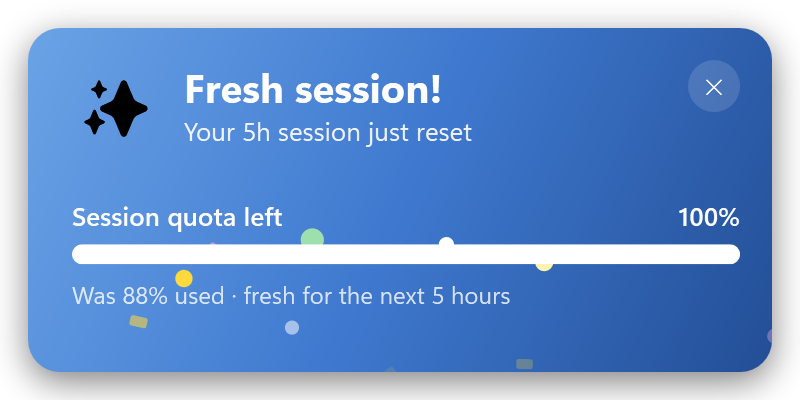
The 5-hour session window rolled over — fresh for the next five hours.
All four resets are on by default — toggle each one independently in Settings.
The same card, without the confetti
Not everything worth knowing is good news. These three use the same toast and say so plainly — one about what every session costs you before you type, one about the moment your quota stops being included, and one confirming a change you cannot otherwise see.
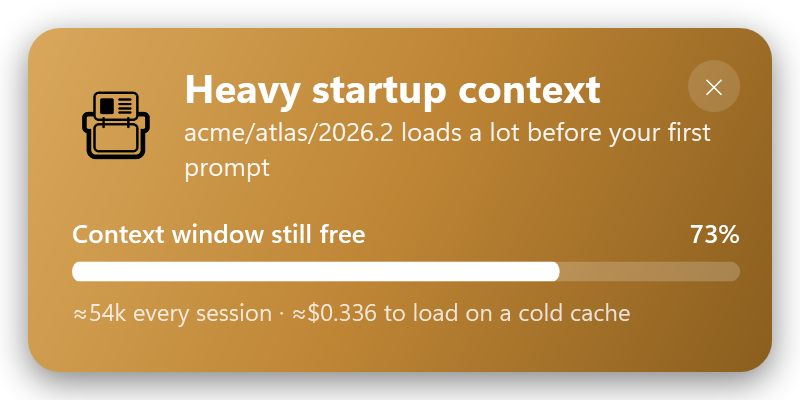
A project's instruction files, memory and skills have grown enough that every session pays for them before you type a word — with what it costs to load on a cold cache. At most once per project per week, and off by default: nobody asked to be told their own files are growing.
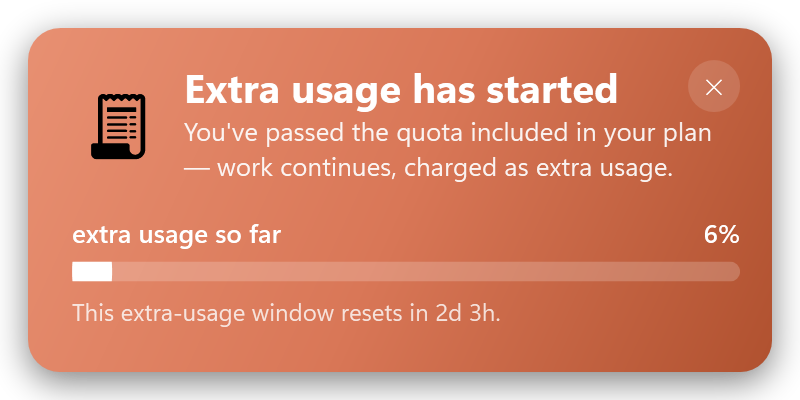
It exists because the four above do: the app interrupted you to say quota came back and said nothing when you started paying. Fires once when a check first finds you past your included quota — not on a timer, not again while the same spell lasts. A receipt, not a prompt.
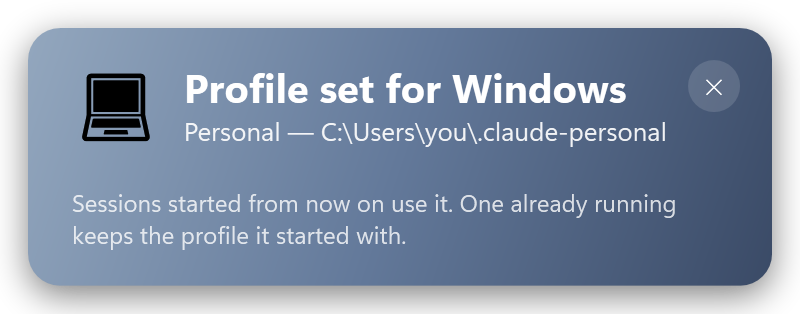
Writing the machine-wide profile is the least visible thing this app does — nothing on screen changes until you start another program. So it confirms itself: only when you switch by hand, once per switch, and only after the variable is read back. No quota bar, because animating one account's remaining quota into another's would suggest switching accounts because one ran out.
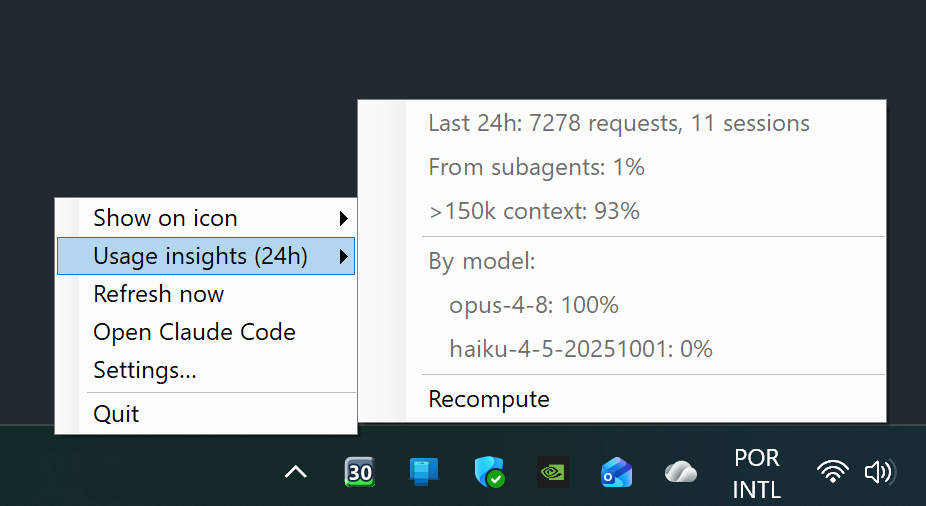
Know where your tokens actually go
The Usage insights (24h) menu is computed entirely on your machine from Claude Code's session transcripts — weighted by per-model price, so the numbers reflect real cost rather than request count.
- ✓Last 24h — request and session counts
- ✓From subagents — the share of usage from sidechain requests
- ✓>150k context — the share from large-context prompts
- ✓By model — the top models (Opus / Sonnet / Haiku / Fable) by share
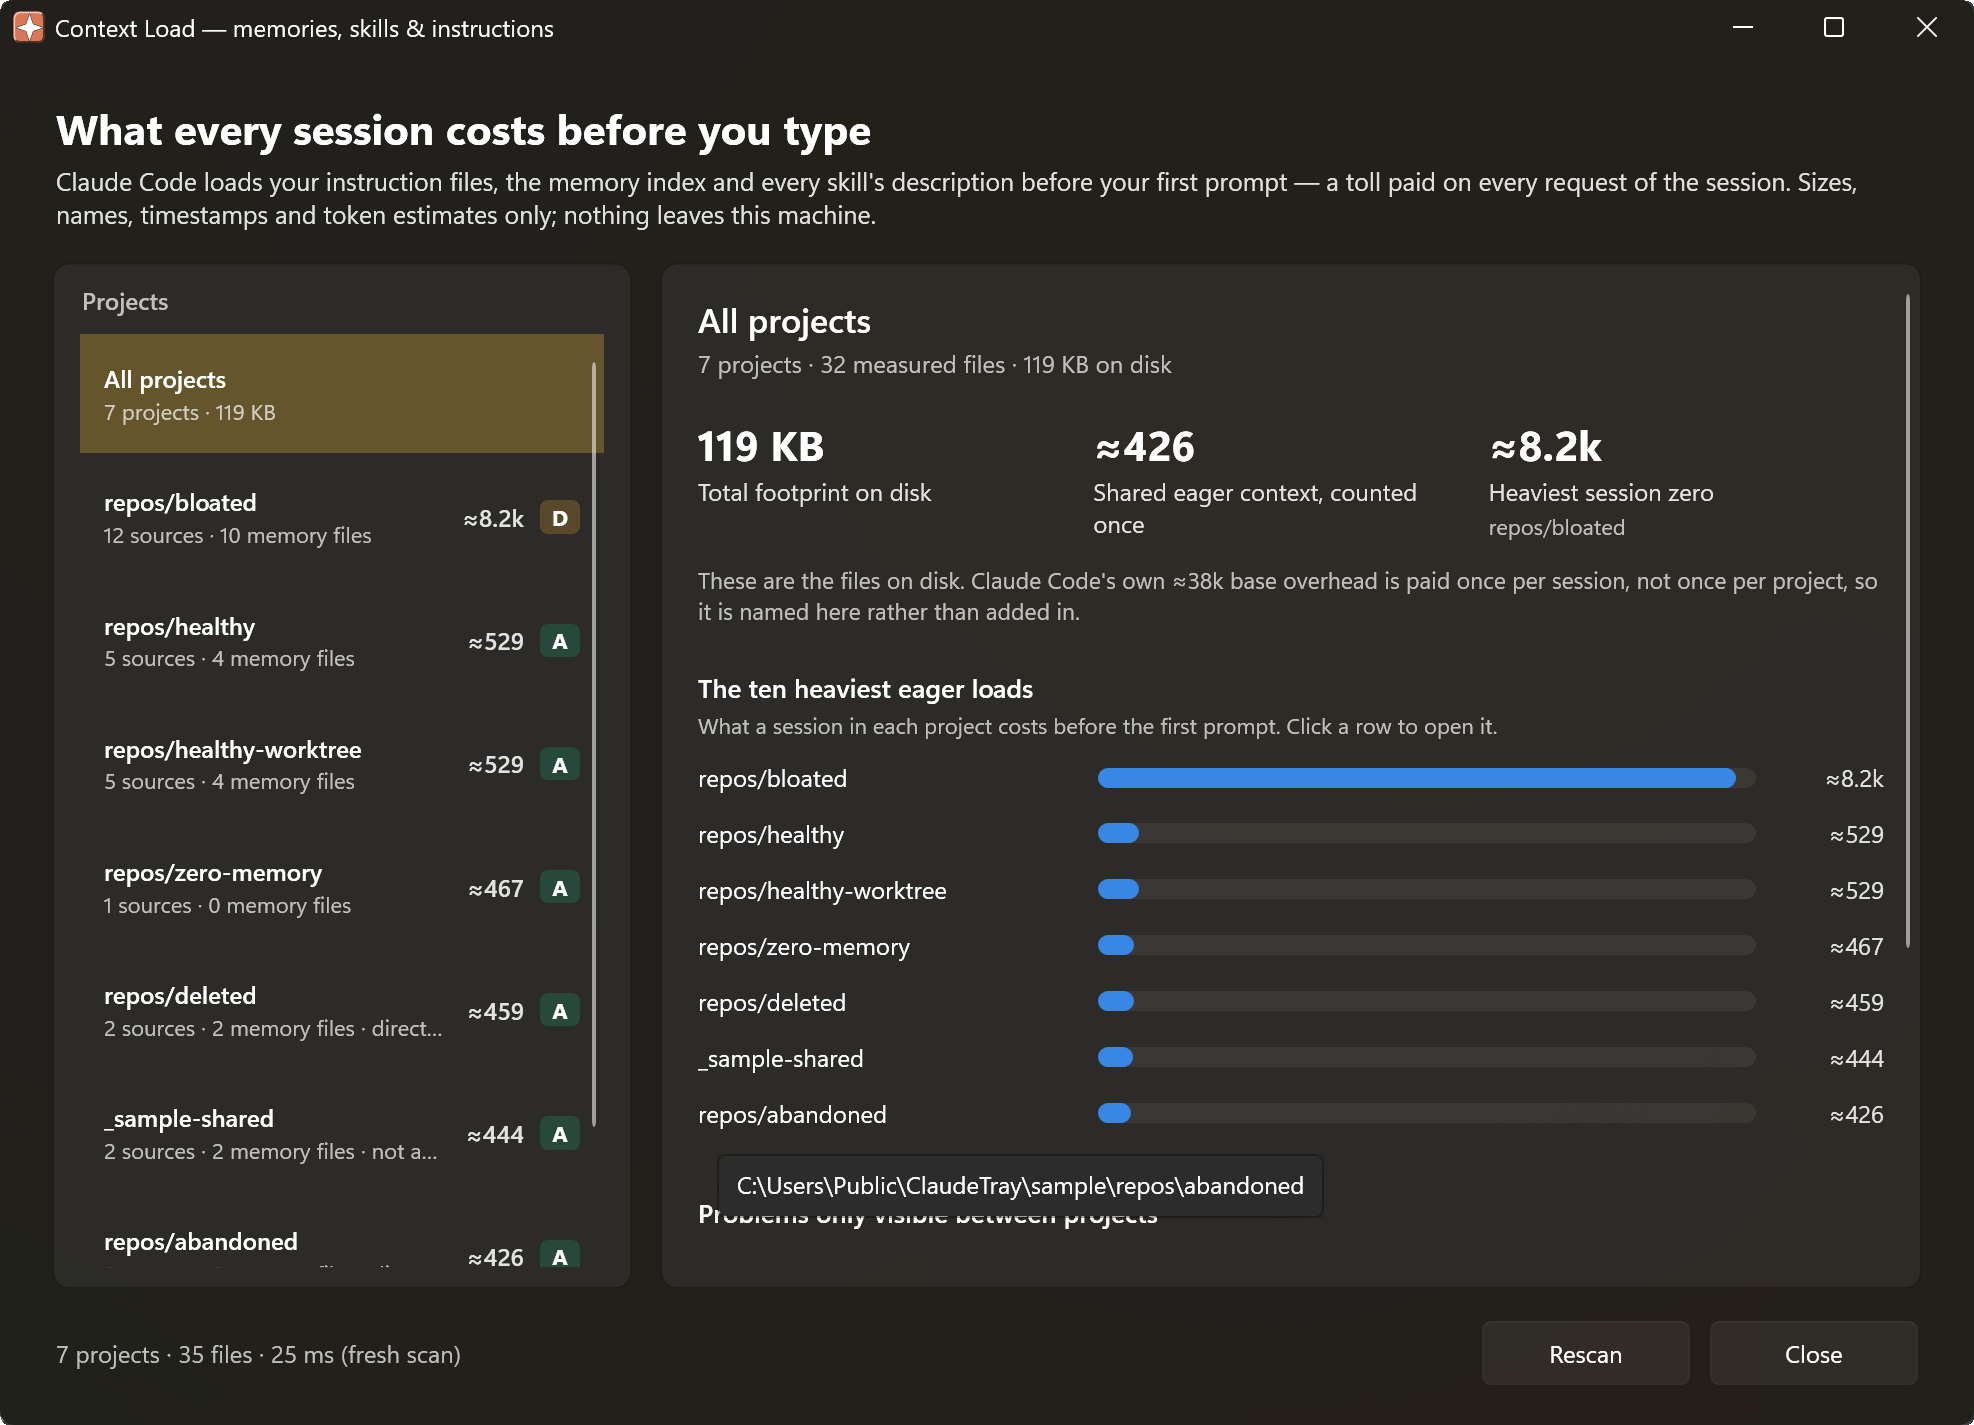
What every session costs before you type
Claude Code loads your instruction files, your memory index and every skill's description before your first prompt — a toll paid on every request of the session, and normally invisible.
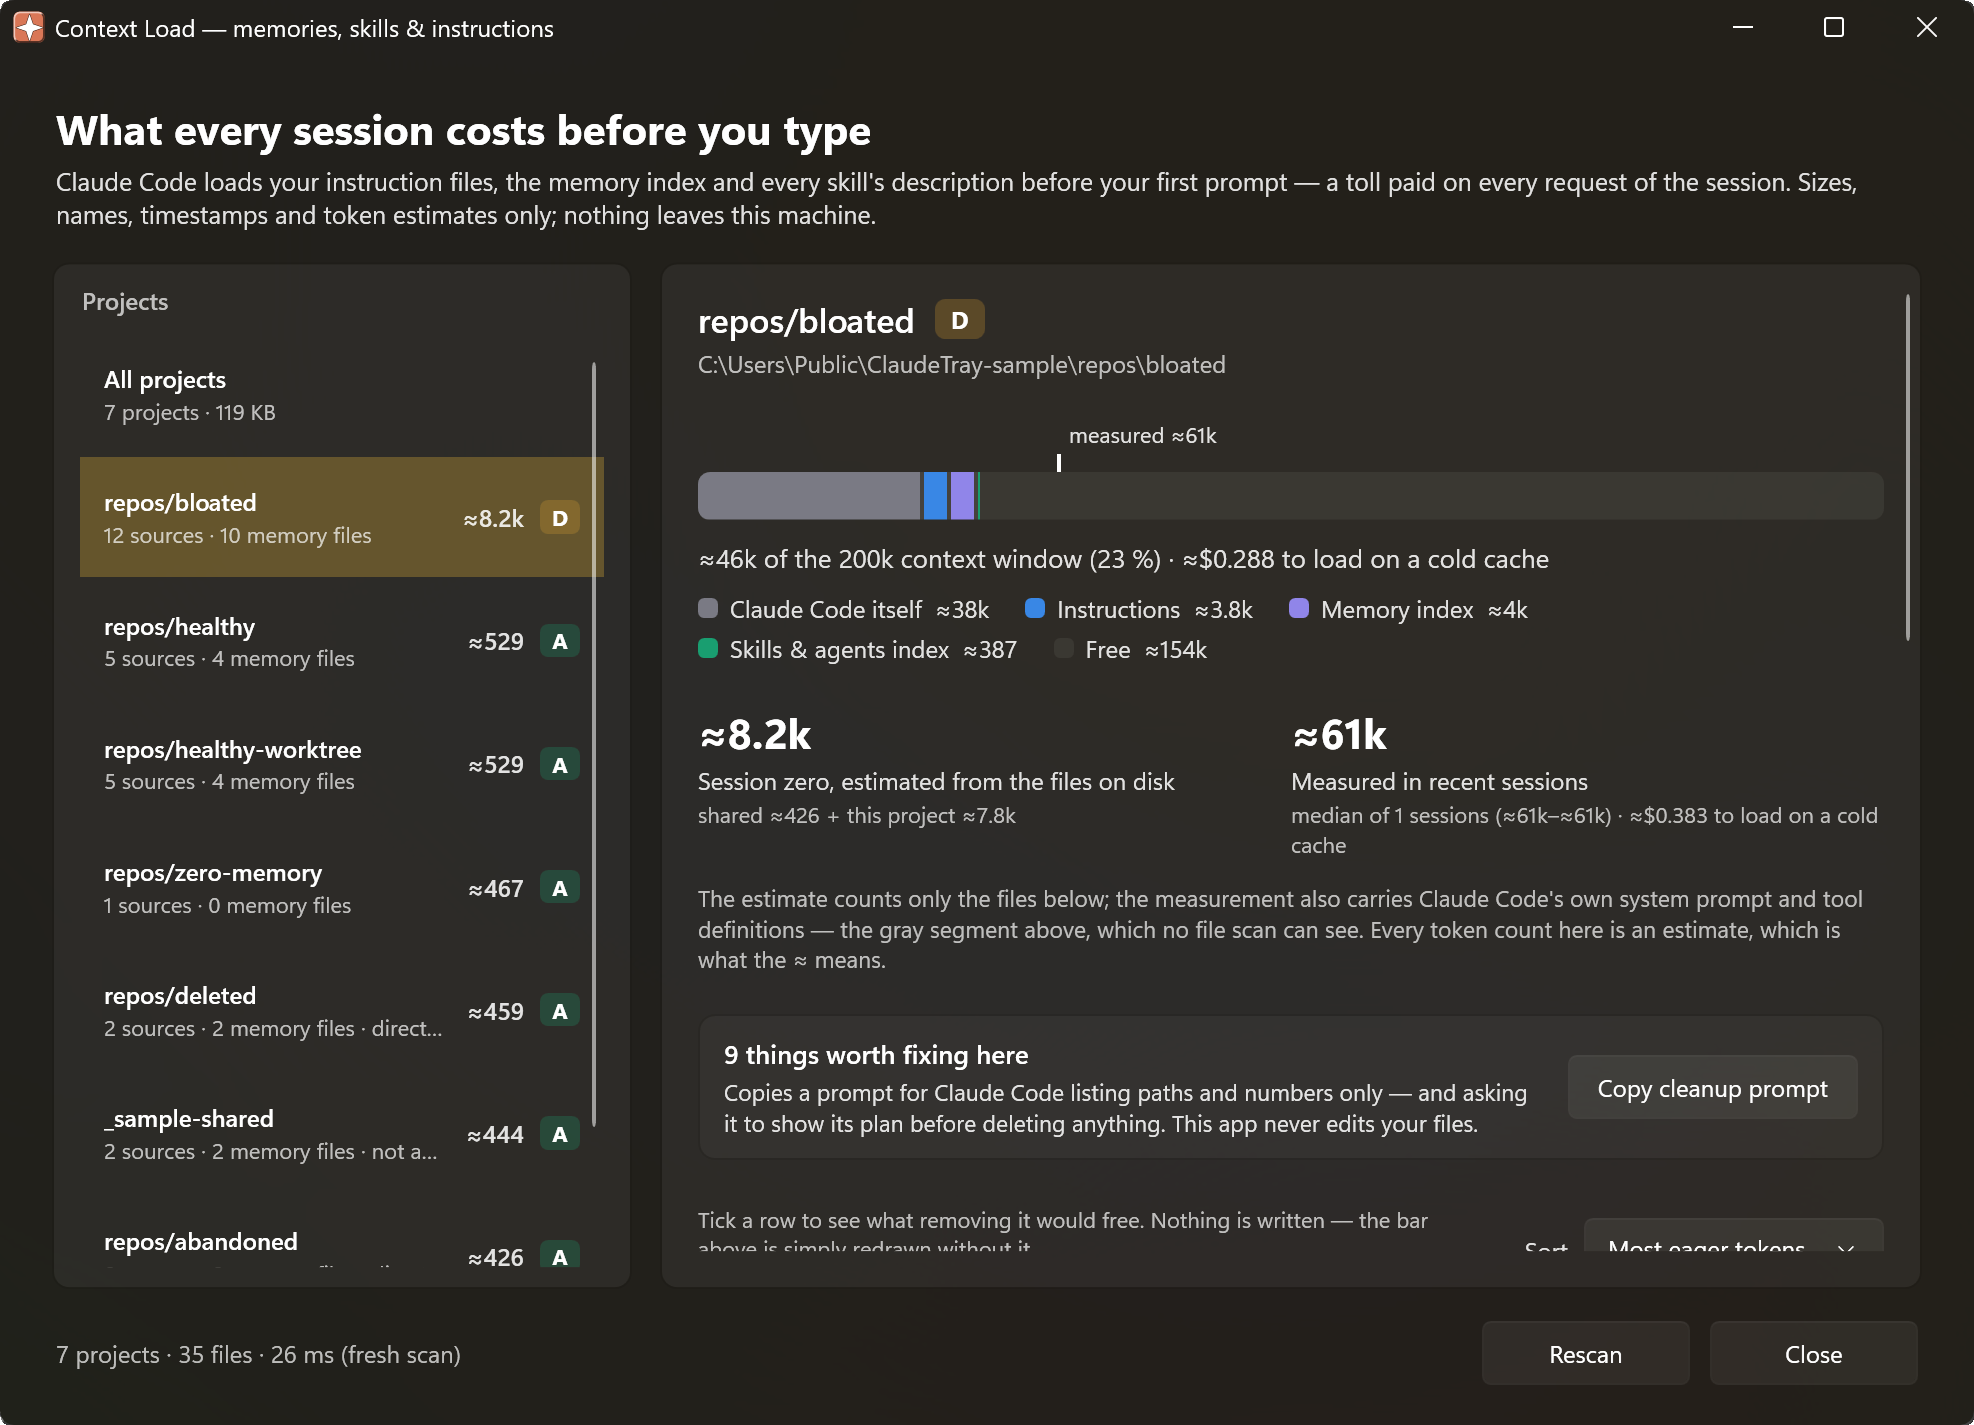
Then tells you what to do about it
Every finding comes with one plain sentence and the concrete fix — and the only action is Copy cleanup prompt, which hands paths and numbers to Claude Code. This app measures your files; it never edits them.
- ✓Eager vs lazy — a 300 KB memory directory can cost less than one bloated
AGENTS.md - ✓Was it ever used? — skills annotated 45× or never, mined from your own transcripts
- ✓What-if — tick rows and watch the gauge and the cost drop, before changing anything
- ✓Grade and drift — A–F per project, and “+2.4 KB in the last 7 days”
- ✓Between projects — duplicated memory directories and dead project directories, invisible from inside either
Which plan am I actually on?
Settings has a page that answers it without you opening a single JSON file — and it is read-only, like everything else here.
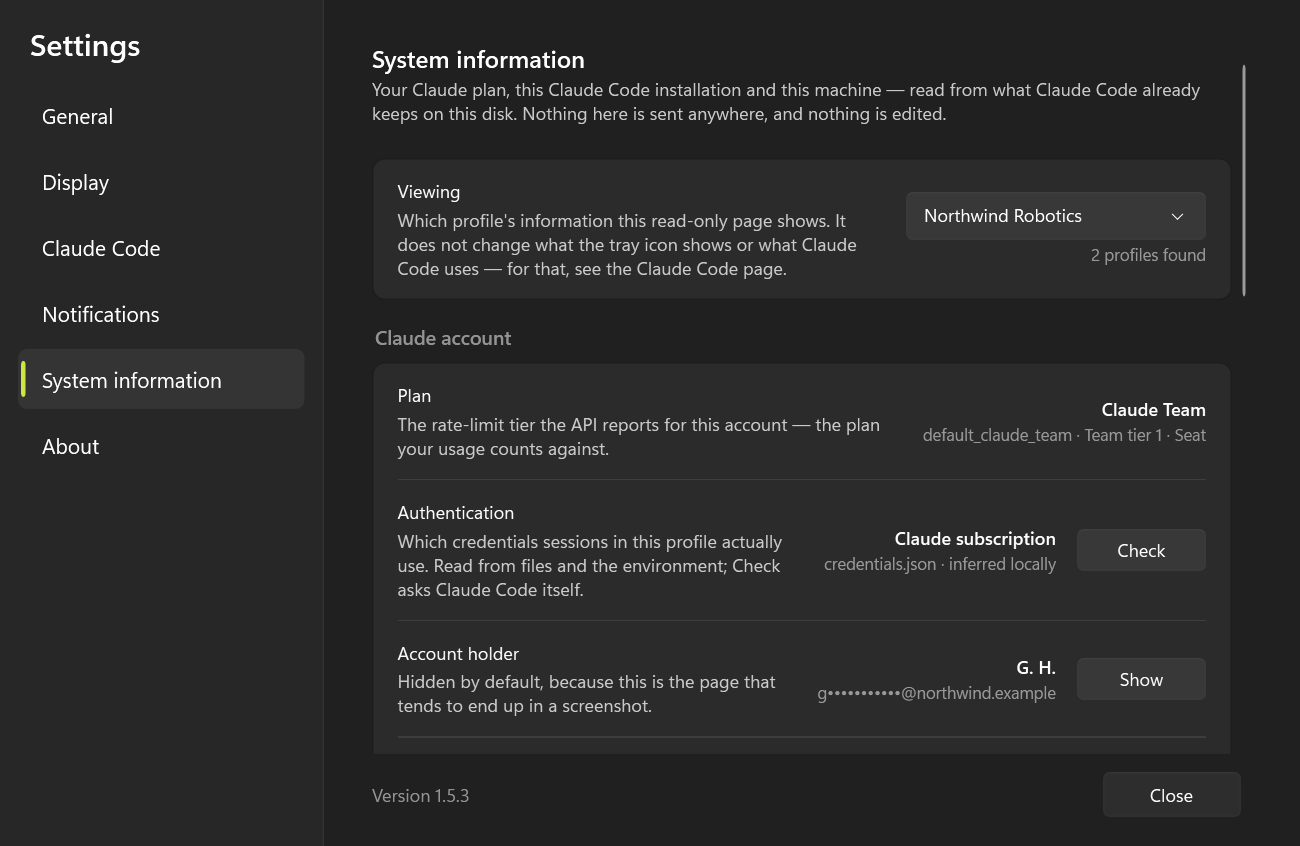
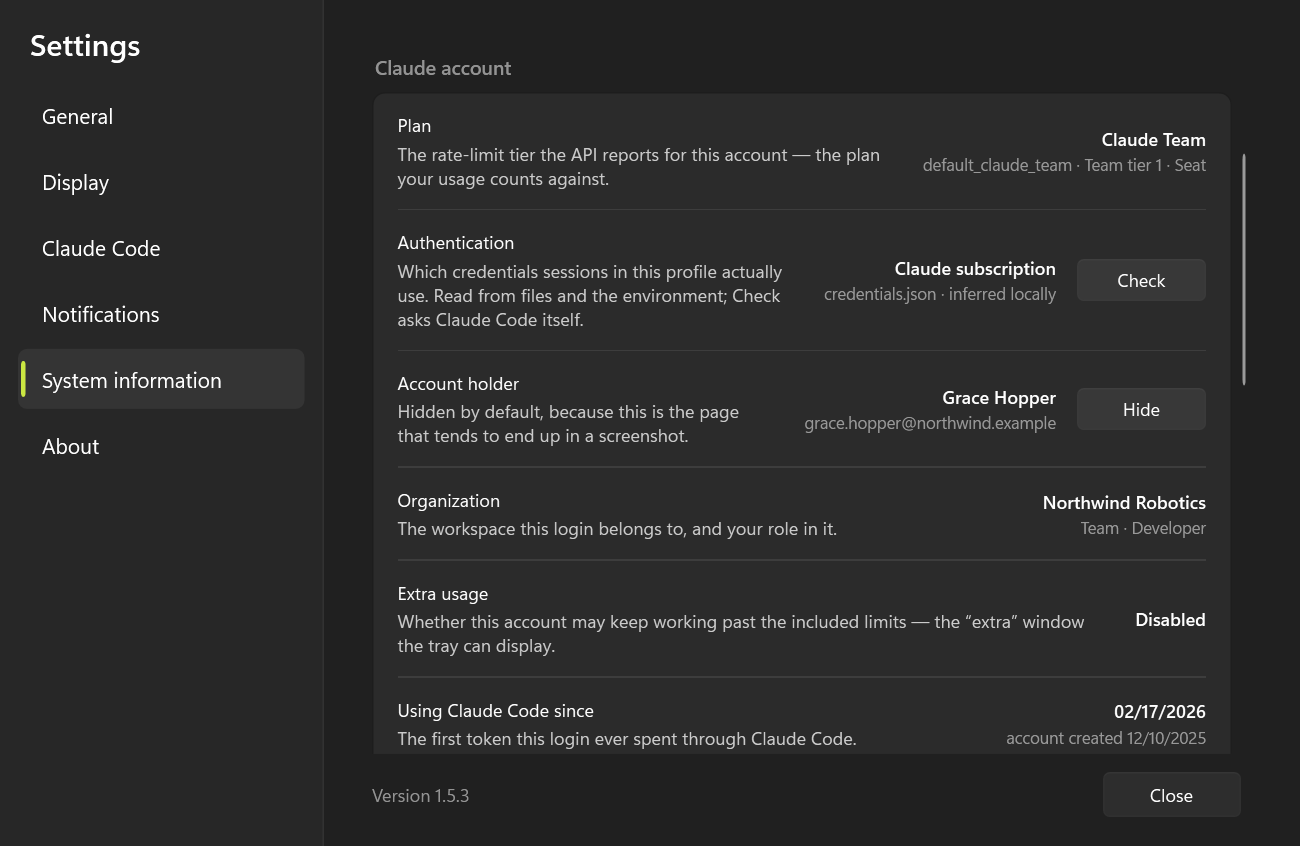
Your plan, by name
The rate-limit tier the API reports for your login, read as you would say it — Claude Max 5x — with the raw tier, seat and billing type underneath. Plus whether extra usage is enabled, why the API is refusing it when it is, and how long your stored sign-in is valid.
Work and personal, one click apart
Claude Code keeps one account per configuration folder. Register them once and Open Claude Code becomes a submenu — each profile launches with its own folder, its own login and its own working directory, so the work account cannot open in a personal repo. The tray never writes to a config folder and never moves credentials: it passes CLAUDE_CONFIG_DIR and lets Claude Code do the rest.
… or the whole machine follows
Turn on Use the chosen profile everywhere in Windows and picking a profile writes CLAUDE_CONFIG_DIR into your user environment — so a terminal you open yourself and an editor started from the Start menu use it too, not only what the tray launches. It follows the profile you choose, never the one auto-follow drifts to. Off by default, and reversible.
The icon keeps up on its own
Turn on Follow the active profile and the icon moves to whichever profile Claude Code last worked in — no click to switch. Read from transcript timestamps only, on the refresh you already pay for. Picking a profile by hand pins the icon there until you click Resume following. Off by default — and it tells you when it cannot do anything: two profiles reading one project history report the same last turn, which is the same fact twice, so the setting's own description says so instead of leaving you a switch that looks on and never moves the icon.
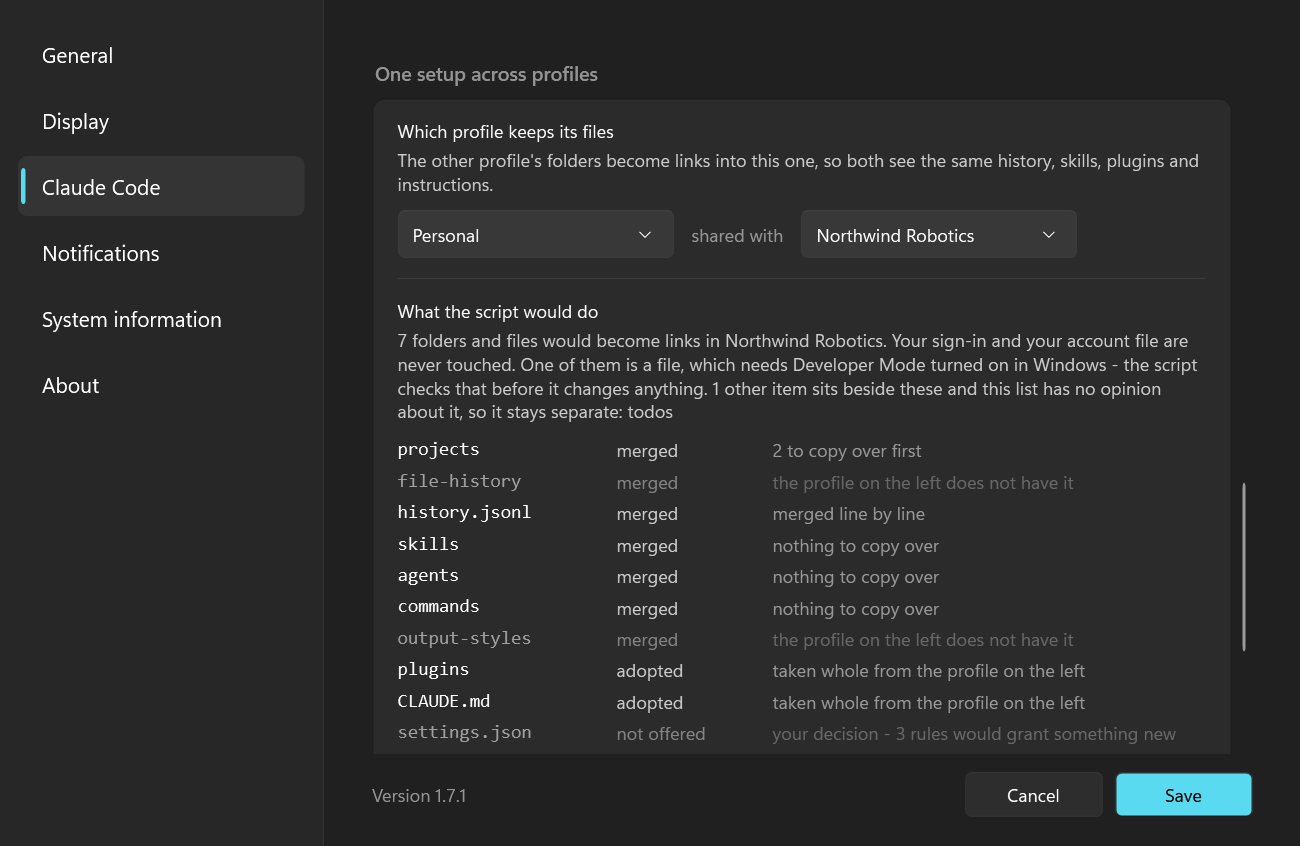
Or make the two one setup
Two profiles start genuinely empty of each other — right when they are two jobs, in the way when they are one person changing subscription. Pick which profile keeps its files and the page shows, folder by folder, what sharing them would mean: merged for your projects, session history and skills, with the number that would be copied over; adopted whole for plugins and your CLAUDE.md; not offered for settings.json, because a union would widen the other account's permission allowlist and that is your call — so the script shows you what you are deciding: how many rules arrive on each side, in which lists, and the ones landing in deny counted apart, since those take capability away rather than granting it; and never for your sign-in and the file that makes it a separate account. And it names everything else in the two folders that it has no opinion about — because a list of opinions that says nothing about what is not on it reads as a complete one.
It hands you a script, not a button
This app cannot write into a configuration folder and is not growing a way to, so it writes a PowerShell script where you point it and opens the folder. Read it first. Even then a bare run only prints what it would do — it takes a second run with -Apply to change anything. It never asks for administrator rights, and it never deletes: every original is renamed beside its link, so you can put it back. Its header also names the one consequence — both profiles then report the same last turn, so Follow the active profile stops moving the icon between that pair — before you run it rather than weeks after.
Masked by default
Account holder, email and absolute paths are hidden until you ask for them, because this is the page that ends up in a screenshot. Show reveals them, Hide puts them back.
Statistics, per account
The Statistics window reports on one profile at a time and says which. Switch it at the top and the charts, the projection, the weekly shape and the live throughput are all recomputed from that account's own readings and its own transcripts.
Is it even your subscription?
A folder you have never signed into runs on whatever ANTHROPIC_API_KEY is in your environment — billed per use, and invisible to the 5-hour and weekly windows. The page says which credentials each profile really uses, and warns in plain words when the percentages are not describing what Claude Code is spending.
Your install, at a glance
Installed CLI version, install method, auto-update state, how many projects Claude Code tracks, and the configuration folder — with a button to open it. CLAUDE_CONFIG_DIR is honoured.
Copy for a bug report
Windows build, .NET runtime, architecture and the tray's own version and data folder — the whole page as plain text in one click, exactly as shown, so a masked holder stays masked.
Five pages, one per pillar
Each section above has a page to link at, whether from a README, an issue, or a search result.
The projection
A proportional pace line for the 7-day week and least-squares regression for the 5h session, so the tray warns you before you hit 100% rather than after — and says clay when extra usage is paying, red only when work has stopped.
Read the page →Statistics
Each rate-limit window as a burn-up chart with a dashed projection, a three-minute live throughput strip split by repo and token type, and one row per conversation priced at Anthropic's published API rates.
Read the page →The notifications
Four reset toasts with their own colour and headline so you can read them without reading a word, and three that state a fact instead of celebrating one — a heavy startup context, extra usage starting, and a machine-wide profile switch confirming itself.
Read the page →The context audit
Claude Code loads your instruction files, memory index and every skill description before the first prompt. The context audit measures that toll per project, says which parts were ever used, and hands the fix to Claude Code rather than editing anything.
Read the page →What it reads, and what it sends
Token counts, model ids and flags — never message content, with one visible exception. One 1-token API call every five minutes, history on local disk, and nothing uploaded.
Read the page →Control, without leaving the tray
- ✓Click the icon — one window on the pacing report, with Statistics, Context and Settings as tabs along the top: everything is navigated to, nothing opens a second window
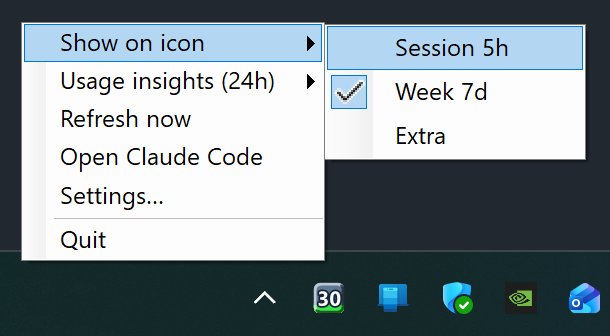
- ✓Show on icon — switch between Session 5h / Week 7d / Extra, remembered across restarts
- ✓Used or remaining — flip the icon to count down your remaining quota instead of counting up usage
- ✓Profile — with more than one Claude Code profile: each one's usage, a check on the one the icon follows, click to switch
- ✓Refresh now — an immediate API read
- ✓Open Claude Code — re-authenticate in one click if the token expires
- ✓Update to vX.Y.Z — appears only when a newer release exists
Up and running in two minutes
Already using Claude Code? Then you're already set up.
Have Claude Code
Install it and run claude once, so it stores your login token.
Install it
One command with winget, or grab ClaudeTray-Setup.exe from Releases. Per-user, no admin.
It just works
The icon appears in your tray and starts reporting. Right-click for options.
Install from the Windows Package Manager:
winget install alegauss.ClaudeCodeTrayPrefer a direct download? Grab the installer below.
Apache 2.0, and building from source is documented in the README. The tray never writes to a Claude Code configuration folder — it passes CLAUDE_CONFIG_DIR and reads what is already there.